Fed Rigging Payroll “It’s A Trap!”

(This post is two weeks delayed. No Wifi in my new apartment. Too LOFTY of a goal)

The Federal Reserve has become very successful at dominating market headlines in the past couple of weeks while failing to convince anyone that their monetary policy is going to elicit change. Starting with Janet Yellen’s speech at Jackson Hole on August 26th, investors have been lined up hoping that the Fed Chairman or any of the economic data released in the past two weeks would provide insight into the likelihood of a 2016 rate hike. Unsurprisingly, the Fed managed to weave a web of ambiguous rhetoric. Yellen made no promises, said nothing definitive, and she made sure to quell any fears of a low growth economy. Yellen cautiously worded her speech, “While economic growth has not been rapid, it has been sufficient to generate further improvement in the labor market… … Indeed, in light of the continued solid performance of the labor market and our outlook for economic activity and inflation, I believe the case for an increase in the federal funds rate has strengthened in recent months.” Well done Janet. Her performance was impressively neutral (bland as always) ensuring that her words couldn’t be warped to create any real news. The speech briefly sent US stocks down and bond yields up, but the only takeaway was that the Fed believes there to be a lower equilibrium interest rate than in the past.

maxresdefaultWithin her explanation of the “monetary policy toolkit”, or of the very few tricks they still have up their sleeves, Yellen provided very little detail regarding future changes to the inflation-targeting framework. Remain skeptical, don’t be the fool who falls into the trap created by fools.

The biggest economic report came last Friday on September 2nd. The reason the total Non Farm Payroll report is so important is because it may be the last shred of proof that the Fed is ‘data-dependent’. Yellen and her posse love citing the unemployment rate and the labor participation rate as reasons for why the economy is rock-solid. Going into Friday I was skeptical that the labor report would produce any noteworthy results. Why? With the presidential election coming up in the near future there is little room for error for each candidate. One of the strongest arguments for another Clinton presidency (besides the obvious one of Trump being a lunatic) is the low unemployment rates under Obama, and how that would continue if another democrat took office. The point is, the Obama administration is currently rigging the non farm payroll reports. They want the reports to be satisfactory enough so that the economy looks strong. At the same time, they can’t be too good or else the Fed would have to raise interest rates which would cause a prick in an inflated bubble right before the election.

Total nonfarm payroll employment increased by 151,000 in August, and the unemployment rate remained at 4.9 percent, according to the U.S. Bureau of Labor Statistics. Both the labor force participation rate, at 62.8 percent, and the employment-population ratio, at 59.7 percent, were unchanged in August. In August, 1.7 million persons were marginally attached to the labor force, about the same as a year earlier. Among the marginally attached, there were 576,000 discouraged workers in August, little different from a year earlier. This jobs report was about as exciting as Rosie O Donald’s sex life à very round numbers with very little movement up or down. So the government did their job and the chances for a September hike dropped significantly. But that doesn’t mean there isn’t some dissent within the Federal Reserve community. Boston Fed President Eric Rosengren said in a speech on Friday September 9th that “gradual interest rate increases might be in order with the U.S. economy at full employment and that low interest rates were increasing the chance of an overheated economy.”

Let’s check out the other numbers that have been released since Jackson Hole. Whether good or bad, there’s a decent chance that the Fed hasn’t even taken a look at these numbers yet.

 Consumer Confidence Index – August 30th

The CCI which had decreased slightly in July, increased in August. The Index now stands at 101.1 (1985=100), compared to 96.7 in July. Short-term expectations regarding business and employment conditions, as well as personal income prospects improved, suggesting the possibility of a moderate pick-up in growth in the coming months.

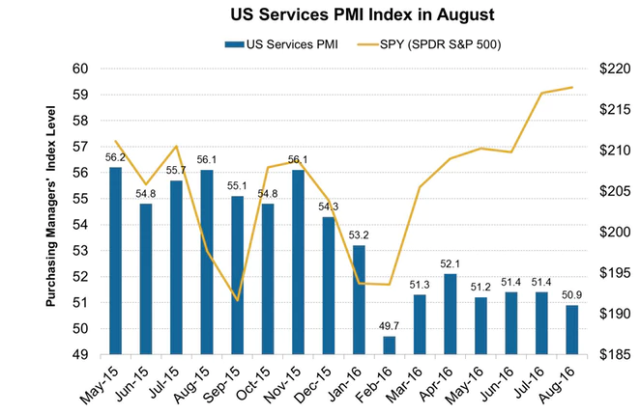
US Markit Services PMI – September 7th

At 51.0 in August, the seasonally adjusted Markit final U.S. Services Business Activity Index dropped from 51.4 in July but remained above the 50.0 (no-change value) for the sixth consecutive month.

Contrasting the Consumer Confidence Report, the weaker-than-expected PMI report sends a downbeat note on economic growth in the third quarter. According to the Markit release the services PMI as well as the manufacturing PMI are pointing to an annualized GDP growth rate of 1%. With low growth and inflationary pressures subdued, the Fed will hesitate to be hawkish in the near future.

Capture.PNG

ISM Manufacturing – September 6th

The August PMI registered 49.4 percent, a decrease of 3.2 percentage points from the July reading of 52.6 percent. The New Orders Index registered 49.1 percent, a decrease of 7.8 percentage points from the July reading of 56.9 percent. The Production Index registered 49.6 percent, 5.8 percentage points lower than the July reading of 55.4 percent.

These numbers all came in surprisingly weak with the August PMI value of 49.4 being considered in contraction mode.

NMI  registered 51.4 percent in August, 4.1 percentage points lower than the July reading of 55.5 percent. This represents continued growth in the non-manufacturing sector at a slower rate. The Non-Manufacturing Business Activity Index decreased substantially to 51.8 percent, 7.5 percentage points lower than the July reading of 59.3 percent, reflecting growth for the 85th consecutive month, at a notably slower rate in August.

The NMI represents growth (or lack-there-of) in the service sector. Two weeks before the FOMC policy meeting this paints a very bleak picture. Will the Fed cite this as the reason for not hiking rates? Will the claim they are data-dependent? Or will they ignore this horrible piece of data in order to paint a prettier picture of the US economy before the election?

Tune in next week to find out what happens next.


ttps://www.conference-board.org/data/consumerconfidence.cfmhttps://

http://www.markiteconomics.com/Survey/PressRelease.mvc/6805ea86f91a414f832731e9f506d942

Oil Will Drop to $40 Before Rising to $50

Oil has dropped about 13% since its high of $51.67 in early June. On Friday NYMEX September crude fell 56 cents at $44.19/b. ICE September Brent settled down 51 cents at $45.69/b. The US Dollar Index reached 97.5 Friday, its highest level since March 10. A stronger dollar makes fuel imports more expensive for holders of other currencies. The Brexit vote raised concerns about European economic strength.

My last report on oil occurred in early June as futures prices broke the $50 mark for the first time in a rally driven by a US decrease in production and a weakening dollar. I claimed that it was highly unlikely for oil to rise to $60 because of three reasons: Middle Eastern production, temporary outages, and the Bullwhip Effect. Saudi Arabia, who is very capable of operating in a low price scenario, showed no signs of slowing down and Iran is determined to rapidly ramp up their production. Nigeria and Canada’s outages helped spark a rise in oil prices, but the effect of those short-term catastrophes is waning. All eyes have been on US production, gasoline inventories and demand, and the overall economic outlook. And sure enough as oil prices rose US energy companies eagerly watched the futures ticker, salivating over the idea of $60/b. Cautiously optimistic, production has continued to decrease, but the opposite is true for active rigs revealing that US companies are more adept at operating in a low-cost environment and are tempted to revamp operations.

Nigeria and Canada

The outlook for these two past market movers is split. The Nigerian oil industry risks sinking deeper into crisis in the months ahead with more disruptions to oil output and exports as the government’s dialogue with militant groups has failed to curb violence in the Niger Delta. Some 700,000 b/d of Nigerian oil output is currently shut-in due to the latest wave of attacks on pipelines and other production facilities in the Niger Delta region, the state oil firm NNPC said Thursday, taking production to around 1.5 million b/d. Nigerian officials hope that production will normalize soon but these seems increasingly unlikely.

Canadian companies are slowly showing signs of life after the wildfires that plagued multiple oil sites abated. The number of oil and natural gas wells drilled in the second quarter of 2016 in Canada fell 58% but there are some signs of resurrection. Three leading oil sands producers — Cenovus Energy, Canadian Natural Resources and a joint venture between ConocoPhillips and Total E&P Canada — have remained on track to add a combined raw bitumen production capacity of over 300,000 b/d by late 2017. Drilling activity is also expected to be maintained in the Montney and Duvernay. According to the CEO of Canadian drilling company Precision “We have started off [Q3] with 29 rigs each in Canada and the US and our hope will be for the rig fleets to remain in service. With a few more dollars of increase in [the] oil price, we will move up nicely, and in the WTI $60/b to $65/b range, we can expect all our 200 rigs to be contracted”.

US Production

Falling US crude production and inventories have offered support for the market despite the recent drop below $50.

The July Short-Term Energy Outlook (STEO) forecasts crude oil production from the Lower 48 states to continue to decline through the rest of 2016, then level off in the first and second quarters of 2017. This production forecast is predicated on the WTI price forecast in STEO, which rises from an average of $47/b in third-quarter 2016 to an average of $50/b Capture.PNGin second-quarter 2017. Crude inventories fell 2.34 MMbbl last week, according to the Energy Information Administration.

Despite decreasing production drilling rigs targeting crude in the U.S. rose by 14 to 371, after 27 were added since the start of the month, Baker Hughes Inc. said on its website Friday. While declines from existing wells are expected to result in a net decrease in production, increased drilling and higher well productivity are expected to soften the decline. The new-well oil production per rig through July 2016 averaged 796 b/d in the Bakken region (within the Williston Basin), 983 b/d in the Eagle Ford, and 470 b/d in the Permian, according to EIA’s latest Drilling Productivity Report.

dpmapv4l-wtitle.png


Also US gasoline inventories stood at 241 million barrels the week ended July 15, a 12.1% surplus to the five-year average for the same time of year, according to Energy Information Administration data.

-1x-1


So What Does All of This Mean?

US data remained the key driver in oil prices for the past month or so. The lower production provided optimism for both investors and companies alike. The ambiance surrounding the black-gold elites improved to be less depressing and more forward-looking. Halliburton CEO Dave Lesar said Wednesday, “Today our customers are thinking about growing their business again rather than being focused on survival.” It only seems logical that while US production helped ignite the rally, any signs of weakness or supply gluts will drastically lower prices. Ceterus Paribus, in a best case scenario, with Russia, Iran, Nigeria, and Canada’s storages remaining the same then that leaves the US to decrease production. Rig counts, gasoline inventories, and increased optimism show that the US may not be so aggressive in curbing output. With the peak driving season considered to be ending in September look for a glut either on the crude or refined sides leading to $40 prices.


http://www.platts.com/news-feature/2016/oil/african-energy-outlook/index

http://www.platts.com/latest-news/oil/calgary/canadian-q2-oil-gas-drilling-falls-57-signs-of-21050812

http://www.eia.gov/petroleum/weekly/

http://www.bloomberg.com/news/articles/2016-07-21/oil-heads-for-weekly-loss-amid-ample-u-s-crude-fuel-stockpiles

Please Don’t Become a Magikarp

These past few weeks are a testament to the average person’s 7-second attention span or however short it is… I was too distracted to read the whole article. Apparently our attention span loses in length even to that of a goldfish. Undoubtedly, the increased dependence on digital processing, social media, and smartphones have allowed us to no longer need to sustain focus for a long period of time. Why commit things to memory when you can look information up in a matter of seconds? Many people get their news from Twitter, short articles, or horrifyingly enough from Facebook. This inability to retain bits and pieces of fact or fiction gathered from various media sources has proved very resourceful recently. Because if humanity were able to maintain a grasp on current events then surely they would go mad. Shootings in Orlando, bombings in Iraq, five police officers dead in Dallas, the massacre in Nice, a military coup in Turkey. If any sane man or women had the capacity to dwell on our world’s reality then they would be crushed by the burdens of human emotion: Surprise, empathy, grief, animosity, and anger. But posting a quick blurb on Facebook is perfect for relieving your conscious while creating the perception that you give a shit. Maybe it’s a blessing. What other choice do we have than to get on with our own lives?

Current events aside let’s turn this goldfish into a Magikarp. For those of you who aren’tdownload.jpg avid Pokemon fans a Magikarp is a Pokémon resembling an orange fish. It is about as useless as the Federal Reserve’s monetary policy. I’m assuming that this Magikarp also has a longer attention span than humans and embodies so many of the faults of this digital age. Because while we choose not to remember the atrocities committed, the victims that need our help, or the political and economic instability ravaging our countries at least we can focus what little attention that we have on PokemonGo. According to Wikipedia, “The game allows players to capture, battle, and train virtual creatures, called Pokémon, who appear on device screens as though in the real world. It makes use of GPS and the camera of compatible devices.”  In the two weeks since PokemonGo has been released it has acquired more users than Twitter, sucked up more Smartphone time than Facebook, with the system briefly shutting down because of the high amount of users. People are roaming the streets staring down at their Smartphones looking to catch the next big Pokémon. The amount of time and energy going into this game are astounding and they provide the perfect escape for people who just can’t handle real life. In some instances it is just plain cowardly.

The Nintendo stock price is flourishing, almost doubling in the past two weeks. They are about to launch a $35 wristband to notify when Pokémon are near. With just $273 million in earnings in 2015, if 5% of users bought this wristband they would generate $1.75 billion in revenue. This is just the tip of the iceberg as Nintendo plans on expanding into other gaming worlds such as Mario and Zelda.

The “Magikarps” of the investing world seem to have even shorter memories then the millions of Smartphone users. This week was capped off by good news in the retail sector.  Sales rose 0.6% in June from May, which was far above the 0.1% consensus from the Street. Sales rose in virtually every category, even department stores. The only categories to see sales drop were clothing stores and restaurants and bars.

While people are claiming this bodes well for the economy they forget that May’s initial report was revised down significantly, from a gain of 0.5% to only 0.2%. So the June number, assuming it too isn’t revised, is just an offset of what now appears to be a mediocre May.

The other recent good news came from the June jobs report. The consensus was for 180,000 jobs to be created and the range went from a low of 130,000 to as high as 235,000. The actual number came in at 287,000, over 100,000 jobs above the average consensus. While great numbers I would advise investors to remain cautiously optimistic. Don’t just shrug off the downward revision for the already bad number from May, making it even worse. Initially that number was 38,000 jobs and now it’s just 11,000 jobs. So about 70% of the jobs disappeared.

Euphoria set in this week as US stock markets reached record highs. The Dow Jones ended at 18,513 at the closing bells on Friday. There was a quote in the WSJ that made me cringe. Some analyst claimed that “the market is solid, which means the economy is solid”.  We are in the midst of the second longest bull run in US history spanning seven and a half years. Easy monetary policy was the solution to the Great Recession in 2008 and has continued despite the Feds claims that they will raise rates. The flow of money from central banks in Japan and Europe has resulted in a selloff of Treasury Bills all over the world creating inflated assets, most notably stocks in bonds. With negative yields investors were actually paying to lend money to Berlin on the 10-yr German Bund. With such low returns where else can you put your money but the stock market? The Federal Reserve has been inflating their balance sheet for so long now while experiencing diminishing returns in economic growth. It seems obvious that this money that they’ve been injecting into the markets is not stimulating the working class but is going right back into equities creating a nice big bubble. No matter what the Fed says they can’t raise rates because they realize that the natural brain chemistry of our economy is now wired around easy money; it’s not so easy to quit this type of heroin. The reason the stock market went up this week is because people realize that the strong jobs number does not mean the Fed will raise rates. This paradox of record low interest rates and record high stocks is here to stay.

With a desperate search for adequate returns in this environment there are still places to go. A good place to start would be to protect against inflation through commodities, high-yield bonds, REITs, emerging market equities, and Munis.

This week’s rally did result in a selloff of T-bills with yields rising from 1.547% from 1.366%. With low yields, Treasuries may still not be a bad buy.

Even though a $10,000 investment produces a paltry $158 in annual interest income, returns of bonds have been higher than they were in the past. While many investors focus on the nominal yield they don’t take into account the “real yield” or the yield less the CPI. Currently with low inflation there may be some money to be made. Would you rather have a bond that is yield 1.55% with 1% inflation which equals .55% (Pretty bad I know) or a bond that yields 3% with 4% inflation providing negative returns.

This misperception is known as the “money illusion.” According to Barrons, “The term was coined by Irving Fisher, an economist at Yale University, in his 1928 book of the same name. Fisher defined it as “the failure to perceive that the dollar, or any other unit of money, expands or shrinks in value.”” In the money illusion, nominal figures jump out more vividly than real numbers.

We live in a world where very few people are willing to forgive but are very skilled at forgetting. People can barely predict the direction of the market in a year’s time, much less a week, or even seven seconds. Don’t be a Magikarp, keep your head up, and explore the data from all angles to succeed in today’s market.

Fireworks on the 4th… But not in America

The 4th of July is a remarkable holiday where we celebrate the traditions inspired by our Founding Fathers. The values inculcated from an early age include economic prosperity, democracy, hard-work, and equality. Unfortunately we haven’t really had time to celebrate many of these traditions especially in the financial markets. In the past two weeks all eyes have been on Britain and their referendum to leave the European Union. While there are many possibilities that the UK are considering taking, including establishing another referendum, the uncertainty has decimated the British pound and the more risky assets. But I’m not here to discuss Britain because honestly I find the excessive coverage to be quite vexing. With people so focused on what’s happening overseas there has been little reaction to the United States economic data recently released. While there were very few positive or negative shocks embedded in the data in the month of June, the results seem to be pointing toward a somewhat disappointing second quarter.

GDP:

June 28th

The real GDP was adjusted for a third price estimate with an annual rate of 1.1 percent in the first quarter of 2016, according to the Bureau of Economic Analysis. This was an increase from the second estimate of 0.8 percent.

Originally the GDP numbers reflected more spending on household services, notably on health care and on housing and utilities. The upward revision to real GDP growth moved due to upward revisions to exports and to business investment which was countered by downwards revisions in consumer spending.

88150f72-fe33-4948-b12a-e400b799099a


Corporate Profits:

June 28th

Corporate profits increased 1.8 percent at a quarterly rate in the first quarter of 2016 after decreasing 7.8 percent in the fourth quarter of 2015.

Profits of domestic financial corporations decreased $11.3 billion in the first quarter, compared with a decrease of $24.0 billion in the fourth. Over the last 4 quarters, corporate profits decreased 4.3 percent.

Corpor.png

Click to access gdp1q16_3rd_fax.pdf

Markit Manufacturing PMI:

July 1st

U.S. manufacturers indicated a slight rebound in production volumes during June, helped by the fastest rise in new work since March. However, the latest survey signaled that growth momentum remained relatively subdued in comparison to its post-crisis trend, which the PMI Index registered to be 51.3 in June, up from 50.7 in May and the highest reading for three months.

A rebound in export sales provided a boost to manufacturers’ workloads in June. Moreover, the increase in new orders from abroad was the fastest since September 2014.

The latest reading rounds off the worst quarter for goods producers for six years and with the continuing uncertainty throughout the global markets the outlook for Q2 doesn’t seem to bode well for exporters.

Producers are struggling in the face of the strong dollar, the energy sector decline and
presidential election jitters. With companies searching for any type of stability amid a volatile market, heightened tensions between the UK and the European Union are likely to unsettle the global business environment further in coming months.
Manufacturing.png

https://www.markiteconomics.com/Survey//PressRelease.mvc/6af4890597674e268079c8acfd3446e7


Markit US Services PMI

July 6th

The US Services PMI index increased to 51.4 in June, up fractionally from 51.3 in May. The seasonally adjusted Markit U.S. Services Business Activity Index signaled a further marginal expansion of service sector output.

While rising, the PMI index was hit hard in May and still borders contraction levels (under 50.0). The service levels for the month of June continue to corroborate poor economic prospects in the second quarter. The deflated business confidence and heightened economic uncertainty had acted as a brake on growth in June. Furthermore, the balance of service providers expecting a rise in business activity during the next 12 months reached a fresh survey-record low in June.

Commenting on the PMI data, Chris Williamson, Chief Economist at Markit said:
“Rebound, what rebound? The final PMI numbers confirm the earlier flash PMI signal that the pace of US economic growth remained subdued in the second quarter. While volatile official GDP numbers are widely expected to show a rebound from a lacklustre start to the year, the PMIs suggest the underlying malaise has not gone away. The surveys point to an annualized pace of economic growth of just 1% in the second quarter.”

One piece of good news: New work received by service providers expanded at a moderate pace in June, and the latest upturn was the fastest since January. Much of this was due to an increase in orders that needed to be filled. However, the rate of expansion remained weaker than its post-crisis trend.

https://www.markiteconomics.com/Survey//PressRelease.mvc/bb8b2e3e686e4869894f8c7ac6ab4108


UK PMI Services Index:

July 5th

Growth over the second quarter as a whole was the weakest since the first quarter of 2013 when the current upturn began. Moreover, the 12-month outlook was the darkest since December 2012. Companies often reported that uncertainty linked to the EU referendum had weighed on workloads and incoming new business. The data collection window for the June survey was 13-28 June, with 89% of responses received before 24 June.

The Business Activity Index fell from 53.5 in May to 52.3 in June, matching April’s 38-month low and signaling a relatively weak rate of growth in UK services output.
Economic growth slowed to just 0.2% in the second quarter, with a further loss of momentum in June as Brexit anxiety intensified.

With this anxiety so prevalent before the referendum, I can’t imagine what the service index results are going to be like for July. It is unlikely that policymakers will wait for more data before unleashing additional monetary stimulus. There will definitely be more policy action taken in the next few weeks, as investors fear holding volatile positions in the market and as UK continues to search for new leadership.

https://www.markiteconomics.com/Survey//PressRelease.mvc/b93210b9d29a440383344176b79696c2


US Trade Deficit:

July 6th

The trade gap rose 10.1% from April, the largest rise since August, to a seasonally adjusted $41.14 billion, the Commerce Department said Wednesday. Exports of goods and services fell 0.2% while imports rose 1.6%. However, there is some optimism for Q2 as some economists believe that the headwinds of the strong dollar and the damaged energy sector are behind us.

http://www.wsj.com/articles/u-s-trade-gap-widened-in-may-1467808606

Bad Data Overshadowed by Even Worse Labor Report

The non-farm payroll report was at the forefront of negative data over the past week. While positive labor reports were what helped drive the Fed rate raise in December, I’m guessing that the May job report will put a hold to any potential rate increases this summer. Durable goods did provide one source of good news.

 Labor Report – June 3rd

Economists predicted payrolls would rise by 158,000 when in reality they only rose by 38,000, according the U.S. Bureau of Labor Statistics. It is no surprise that the markets responded negatively to the news with the USD index down 1.51%, oil down .71% and the S&P 500 down .18% on the day.

The unemployment rate declined by 0.3 percentage point to 4.7 percent in May, 5.0 percent mainly because 484,000 people left the workforce.

The number of persons employed part time for economic reasons (also referred to as involuntary part-time workers) increased by 468,000 to 6.4 million in May, after showing little movement since November. These individuals, who would have preferred full-time employment, were working part time because their hours had been cut back or because they were unable to find a full-time job.

While 35,000 employees weren’t included on the payroll report due to a Verizon strike, most of the changes were in health care, manufacturing and professional and technical services.

The only good news was that in May, average hourly earnings for all employees on private nonfarm payrolls increased by 5 cents to $25.59, following an increase of 9 cents in April. Over the year, average hourly earnings have risen by 2.5 percent.

Payroll.PNG

http://www.bls.gov/news.release/empsit.toc.htm


New Orders, Shipments and Inventories – June 3rd

While most of the data was awful in the past week, durable goods provided the one bright spot. New orders for manufactured durable goods in April increased $7.7 billion or 3.4 percent to $235.9 billion.

Transportation equipment led the increase, $7.1 billion or 8.9 percent to $87.1 billion. While this is a great number it is important to note that the automobile industry has been thriving due to low interest rates, an increase in subprime loans, and cheap gasoline.

http://www.census.gov/manufacturing/m3/index.html


PMI Markit Services Index – June 3rd

The seasonally adjusted final Markit U.S. Services Business Activity Index posted 51.3 in May, down from 52.8 in April and well below the post-crisis average (55.6). Although signaling a further overall expansion in business activity, the latest reading was only marginally above the 50.0 no-change threshold.

May data highlighted a renewed fall in business confidence across the service sector. Moreover, the degree of optimism was the weakest since the survey began in October 2009.PMI services.PNG

Commenting on the PMI data, Chris Williamson, Chief Economist at Markit said:

“The service sector reported one of the weakest expansions seen since the recession in May, adding to signs that any rebound of the economy in the second quarter may be disappointingly muted.”

https://www.markiteconomics.com/Survey//PressRelease.mvc/1ee25280d8e94db7a6ffa42d29b3ff91


PMI Manufacturing Index Sales – June 1st

At 50.7 in May, the seasonally adjusted Markit U.S. Manufacturing Purchasing Managers’ Index™ (PMI™) was down fractionally from 50.8 in April and pointed to the weakest manufacturing performance since September 2009.

Chris Williamson commented once again saying,

“For those looking for a rebound in the economy after the lacklustre start to the year, the deteriorating trend in manufacturing is not going to provide any comfort.”

https://www.markiteconomics.com/Survey//PressRelease.mvc/94b2d66aab544244b5d497c58d37abaf


Consumer Confidence Survey

The Conference Board Consumer Confidence Index®, which had decreased in April, declined further in May. The Index now stands at 92.6 (1985=100), down from 94.7 in April. This was a surprisingly large decrease as consumers don’t believe the economic outlook will improve in the short-term. With the terrible labor report and the PMI services report I don’t blame them.

https://www.conference-board.org/data/consumerconfidence.cfm


GDP Revision

GDP increased at an annual rate of 0.8 percent in the first quarter of 2016, up from the initial measurement of .5 percent. So while it is comforting for there to be an improvement, the initial estimate before the actual numbers were released was .9 percent. So while any upward revision is encouraged, the number still fell below estimates.

http://www.bea.gov/newsreleases/national/gdp/gdpnewsrelease.htm

Oil Reaches $50 Milestone… is $60 the Magic Number?

One month ago after the Doha oil meeting I wrote, “From what I know now oil has no reason to approach $50 per barrel. I would still be concerned about oversupply.” My prediction was quickly proven wrong as crude prices shot up in the month of May. Markets continue to remain bullish on crude oil which has been hovering around $50 over the past two weeks. Oil has risen approximately 80% over the past few months with many analysts believing that the negative effects of the global supply glut are coming to an end as prices stabilize.

Brent Prices
Crude Oil Prices

On Thursday June 2nd the OPEC met to discuss production cuts and future policy. As most people expected OPEC didn’t come to any agreement believing that oil prices will continue to rebound even if they continue to incorporate a “hands-off” policy.

The geopolitical environment surrounding middle eastern countries such as Saudi Arabia and Iran haven’t necessarily changed recently. Oil prices mainly rose on US production cuts, outages in Nigeria and Canada, and increasing US consumer demand for gasoline.


Saudi Arabia and Iran

After the ‘failed’ OPEC meeting many countries plan on maintaining their production levels. Iraq’s oil refineries have been very productive and profitable lately. Kuwait is recovering from the workers strike. Russia, Iran and Saudi Arabia continue to pursue more market share.

3-largest-countries-may-2016 Production
Big 3 – Production

Saudi Arabia was an outspoken leader at the OPEC meeting. The Saudi representatives mentioned they were ready to consider a deal to set production limits and to mend relationships between the OPEC members. But saying they will consider a deal and actually executing a deal are two very different initiatives – especially if Iran is not on board.

Saudi Arabia’s total oil production capacity stands at 12.5 million b/d, energy minister Khalid al-Falih said on Thursday. Saudi Arabia pumped 10.18 million b/d in April, according to the latest Platts OPEC production survey, which would mean the kingdom has maintained about 2.3 million b/d of spare capacity. Falih made it very clear that Saudi Arabia’s agenda is to continue to invest in the oil industry while seeking economic diversification elsewhere.

“If you do not invest, it will start to decline,” Falih told reporters in Vienna just before OPEC began its ministerial meeting.

But Falih did not elaborate on how quickly Saudi Arabia could get its maximum production capacity online, nor how long it could be maintained.

Saudi Arabia stockpiles did fall last month for the fifth month in a row. They reached the lowest level in 18 months as the kingdom kept shipping crude to meet customer demand while keeping a lid on production. Stockpiles dropped to 296.7 MMbbl in March from 305.6 MMbbl in February, according to data published on the website of the Riyadh-based Joint Organisations Data Initiative. Stockpiles peaked at 329.4 MMbbl in October. The decrease isn’t enough to have considerable effects on crude prices.

In total, OPEC countries produced 32 million barrels a day throughout the first three months of 2016.


Canada and Nigeria

Production cuts in both Canada and Nigeria also shook the markets but they occurred for very different reasons.

Canada had to shut down many operating facilities and refineries due to wildfires around Alberta. Municipal authorities in Alberta, citing improved conditions Friday May 27th, lifted mandatory evacuation orders for seven oil-sands worker camps and production facilities, including Suncor’s base plant mine and Syncrude’s Mildred Lake operation. More than 1 MMbpd were halted by wildfires that ravaged the region since the start of May.

At least a fifth of Nigerian oil production, equivalent to almost 400,000 bpd, has been shut down as a pipeline closure added to disruptions caused by militant attacks. The military said it would “crush” rebels after oil companies evacuated non-essential workers due to the deteriorating security situation. These attacks could linger for some time and will effect volatility in the long-term.

Canada’s wildfires are more short-term while Nigeria’s militant attacks can rage on for an uncertain amount of time. Either way, I would consider these events non reoccurring charges where production will soon stabilize leading to a reversion in oil prices.


United States Production

US Crude stockpiles fell 3.41 MMbbl last week, the U.S. Energy Information Administration said. Analysts surveyed by Bloomberg had projected a 750,000-bbl gain. Crude output fell to 8.8 MMbpd, the lowest since September 2014.

Refineries reduced operating rates by 0.6 percentage point to 89.1% of capacity even though US refiners typically increase utilization in April and May as they finish maintenance before the summer peak driving season.

So far the United States oil companies have no incentive to revamp production and to reopen drill sites. According to WorldOil “The inventory of drilled-but-uncompleted wells (DUCs) in the U.S. has been building during the cyclical downturn, driven by companies with contracted drilling services drilling but postponing costly well completions… …At $50/bbl these will likely be completed whilst at $60/bbl, drilling programs will likely Us Drilling Rigs
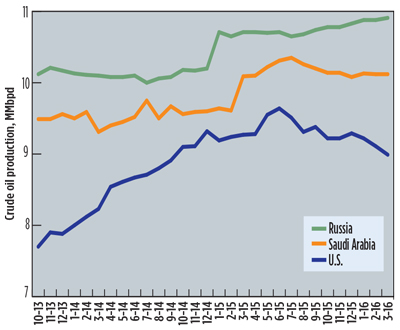
resume and the true test will be whether U.S. crude supplies can be responsive enough to higher prices to actually limit their ascension.”

Citi’s base case calls for U.S. crude output to decline by 650,000 bpd this year. But the recent firming of oil prices could encourage companies to complete these wells, boosting supply by 400,000 bpd or more.

With many analysts expecting a price jump to $60 I believe that this could be the magic number for US production to once again increase. US producers may be in the best position to lead the recovery, given the technical prowess they’ve developed in response to the Drill Costsunique economic environment, by raising production rates and decreasing drill times.

However, these producers do face several headwinds if prices were to continue to increase. Job cuts in the oilfield services sector have made producers less nimble while there have decreases in capital expenditures and the shutting down of multiple plants. Despite the more productive and efficient technology, companies are becoming dependent on some deeper, more complex lateral wells which  lengthen the rebounding process.


Gasoline Demand

Gas Make Up

In the United States, slightly more than half of the vehicle-miles driven in a year occur in the six months from April through September. For the full-year 2016, EIA forecasts U.S. regular gasoline prices to average $1.94/gal. Based on this annual average price, EIA estimates the average household will spend about $350 less on gasoline in 2016 than in 2015 and about $1,000 less than in 2014, when retail gasoline prices averaged more than $3/gal. A summer of high demand will help to lower inventory and increase prices for oil producers.

Summer Gas Prices

I continue to believe that production has not decreased enough to warrant a $60 price target. I think we may see some sort of Bullwhip Effect from the United States if the price continues to increase. The bullwhip effect “is a distribution channel phenomenon in which forecasts yield supply chain inefficiencies. It refers to increasing swings in inventory in response to shifts in customer demand as you move further up the supply chain” (Investopedia). The only difference is that instead of a response to shifts in customer demand it will be a response to shifts in oil prices.


Euphemisms, Ambiguity and Interest Rates

“It is clear that the decline of a language must ultimately have political and economic causes . . . It becomes ugly and inaccurate because our thoughts are foolish, but the slovenliness of our language makes it easier for us to have foolish thoughts. The point is that the process is reversible… If one gets rid of these habits one can think more clearly, and to think clearly is a necessary first step”

– George Orwell


George Orwell was renowned for his disapproval of modern English language. He believed that the use of metaphors, abbreviations, crude words and euphemisms constructed limits to rational thought processes and creativity. In his dystopian novel 1984, which I’m sure I’ve referenced before, the totalitarian government develops a language called Newspeak which removes any undesirable concepts and is a tool to control self-expression and individuality. For example, instead of the words “good, better and bad” in Newspeak ybig-brother-poster-1984ou would use “good, doublegood, and ungood”. By reducing the amount of words in the English language the Party is able carry out both their political and economic agendas more freely.

The finance world is ripe with these linguistic techniques. While financiers aren’t necessarily vying for complete domination (directly), this simplicity evolved from the need for fast-paced communication in order for economies to be more efficient and productive.

However, I would make the argument that financial institutions incorporate this colloquial language constantly to bend market sentiment to their will. Whether positive or negative, investors get lost in the tundra of phrases and lingo, unable to capture the true meaning. Shrouded in ambiguity, these establishments are able to manipulate surrounding opinions.

To me one of the most obvious examples surrounds the “the Great Recession”. I included quotations because the economic crisis of 2008 was not a recession. In actuality one could argue that it was a depression. There are many definitions for what constitutes an economic depression. According to Wikipedia (Yes, this is my blog and I’m a college graduate so I can use Wikipedia if I want… sorry Professors) a depression can be a decline in real GDP exceeding 10%, a recession lasting more than 2 years, or four quarters of negative GDP.

GDP Growth Rate

Let’s take a look at the charts. Yeah, four quarters of negative growth from July 2008 to July 2009. Now why would anyone in the finance industry prefer to call the crash a recession compared to a depression? The bankers, hedge funds, the Federal Reserve, the US government – they all want to lessen the severity of “the Great Recession” so that they could restore investor and consumer confidence in themselves. Thus they steer clear of anything to do with depression.

One of the main reasons for the mortgage crisis of 2008 was subprime lending which is a great term for confusing the general public. Subprime lending really entailed lenders preying on low income individuals with poor credit. Providing these borrowers with easy credit with little regard for the consequences led to excess defaults and the collapse of multiple financial institutions such as Lehman Brothers. Read between the lines.

When it comes to monetary policy the Federal Reserve is great at using these limited communication techniques to mystify speculators. The best example is the concept of “quantitative easing”. QE is nothing more than a euphemism for creating money out of thin air. By inflating their balance sheet the Fed is able to successfully dilute the currency and artificially stimulate the economy. The term “quantitative easing” is a fantastic word for the Fed to demonstrate that they actually had an easy fix for the economy. This expression provides assurance that the government isn’t actually as incompetent as they seem. While Ben Bernanke takes a lot of credit for his ‘successful’ policy, the US economy is currently having trouble reaching a meager 2% growth rate.


May 18th FOMC Minutes

The Federal Reserve monetary policy continues to dominate the market headlines. Janet Yellen loves to talk about the possibility of raising rates but besides the hike in December 2015 they have been unable to do so. However, before every rate hike meeting there is plenty of speculation and market movement resulting from the ambiguous language used by Yellen and her posse.

During the May 18th FOMC meeting minutes the Federal Reserve sent investors a warning that a June rate hike was not completely off the table. Before the meeting there was little possibility of a rate hike but according to the Wall Street Journal, traders in the futures market put a 34% probability on a move by the June 14-15 meeting, up from just 4% a few days before.

There definitely have been some positive economic data releases in the past couple of weeks that provide some explanation to the changing expectations. U.S. retail and food services sales for April were $453.4 billion, an increase of 1.3 percent from March, the CPI rose by .4% in April signaling inflation might be starting to pick up, and the housing sector continued to show signs of improvement as the number of building permits rose.

This was countered by a weak labor report and economic output expanding at a disappointing 0.5% annual pace.

The main reason that the rate hike expectations increased? Because the Fed continued to incorporate optimistic rhetoric throughout the minutes. Atlanta Fed President Dennis Lockhart said he wouldn’t take a June increase off the table, and Dallas Fed President Robert Kaplan called for rate increases “in the not-too-distant future” and said he might advocate for a move in June or July.

In terms of the low growth Fed officials signaled they weren’t overly worried about the apparent slump, judging it was temporary and “could partly reflect measurement problems and, if so, would likely be following by stronger growth in subsequent quarters,” the minutes said.

Seriously how much more indecisive can the Fed be? Janet Yellen is like a mother telling her children that the cat “ran away” even through their father hit it with his car two hours earlier. This change in language was intended to convey the Committee’s sense that the risks associated with global developments had diminished somewhat. All the Fed is trying to do is make it look like they still have multiple options and flexibility in terms of monetary policy when in reality they have their backs against the wall. I would be shocked if they raise rates in June. As long as the delusion persists that they will raise rates the market will continue to rally after the Fed doesn’t actually raise the rates. It’s a self-perpetuating cycle that will continue to prop up the stock market as investors will continue to pour money into riskier assets in search of yield. Finally, if the Fed actually does raise rates these artificial stock valuations could enter correction territory… All because Yellen is very good at using simple words to convince people of something she most likely (hypocrite) won’t do.


http://www.wsj.com/articles/fed-minutes-officials-keep-open-possibility-of-june-rate-increase-1463594811

Click to access fomcminutes20160427.pdf

http://www.nber.org/releases/

Where Does Oil Go From Here?

“The plunge and then surge of commodity prices this year shows investors have spent more time watching each other than watching the fundamentals”


Tomorrow is a big day in the global markets with three significant economic releases: the Fed policy meeting, the Bank of Japan policy meeting and a crude oil inventory report. These three reports each will provide some sort of insight into the economy’s direction in the next three months.

Oil will be heavily influenced on the outcome of both the Fed report and the inventories report. The economic instability, strong dollar, and supply gut earlier this year left oil crashing below $27 per barrel. Oil’s decline had wiped out over 10,000 jobs and resulted in more and more energy company bankruptcies. Uncertainty, the sworn enemy of Wall Street, has seemed to be beaten back. Global markets have stabilized in March and April but they are still entering unknown territory with such a drastic difference in monetary policies in countries such as Japan, Europe the United States and China. With oil recovering from its lows of below $27 a barrel to approximately $44.40 on Tuesday the next question is where will it go from here?

On April 17th there was a much anticipated meeting between some of the world’s largest oil producers to see if they could come to an agreement to freeze production output and thus raise prices. The talks were destined to fail. Iran choose not to attend the meeting, intent on raising production to meet pre US sanction supply. Saudi Arabia put the nail in the coffin when they demanded that they would only cap their production levels if Iran did the same.

US Gasoline Demand

Crude indexes were volatile the week before the meeting but surprisingly many investors shrugged off the failure to come to an agreement. Much of this was due to the surge in gasoline demand in the US. US gasoline consumption, averaged over four weeks, rose 3.9 percent from a year earlier to 9.39 million barrels a day through April 15, Energy Information Administration data show. Demand this summer will increase 1.4 percent to a record, the EIA said April 12. Along with this robust demand there are still expectations that production will decline as they did when distillate inventories decreased by 1.1 million barrels in late March.

“Gasoline demand is quite strong and that’s all price driven,” said Thomas Finlon, director of Energy Analytics Group LLC in Wellington, Florida. “Demand for gasoline should provide support for crude.”

Saudi Arabia vs Iran

Russia has been at the forefront of expressing a willingness to negotiate. However, the world’s largest oil producer isn’t stupid. Russia doesn’t anticipate any new initiatives to freeze oil production before an OPEC meeting scheduled for June, according to Energy Minister Alexander Novak. The majority of the inability to negotiate stems from the competitive relationship between Russia’s ally Iran and Saudi Arabia.

Despite Deputy Crown Prince Mohammed bin Salman’s attempt to diversify Saudi Arabia’s economy over the next couple of years, for the time being they will continue to have to be dependent on their black gold. They can continuing taking advantage of their location sites near the surface of the desert and the large size of their fields. Saudi Arabia is in the best position to operate on the global scale as they have the lowest costs of production per barrel alleviating some of the damage from these low prices. They have also established long term contracts with countries such as Japan allowing for a lot more security in demand.

With the lifting of sanctions Iran is looking to ramp its exports back up to two million barrels a day and regain its market share in Europe. They are currently increasing production by 300 to 350 thousand barrels a day and are shooting for 500 thousand in the upcoming months. They are trying to diversify into Asian markets which will be difficult because of the price pressure that Saudi Arabia creates with their long term contracts.

I don’t see any reason for two of the largest producers of oil to curb production.

Capture
What about the US?

U.S. oil prices have climbed more than 60% from a 13-year low reached in February. This increase is despite many indicators that global supply is going to be cut. Even though prices have been boosted by the surge in gasoline demand which I mentioned earlier, much of the positive sentiment stems from an improving economic outlook.

US oil producers have been hit hard in the past year. US producers have entered 2016 with estimated capital expenditures cuts of 40%, more than 6,500 drilled but uncompleted wells in inventory, and find themselves operating at or near cash costs.

Analyst of Platts Oil Suzanne Minter does a great report on the ability of the US to respond to an increase in oil prices. She states that, “It is plausible to believe that U.S. spare capacity may be close to rivaling OPEC’s current spare capacity. However, we believe that the prices needed to incentivize the U.S. producer to complete their drilled but uncompleted wells may be much lower than global competitors believe or would like it to be.”

Suzanne basically says that prices are too low right now and that US companies are waiting for the prices to catch up in order to revamp production. She continues to say, “US producers may be in the best position to lead the recovery, given the technical prowess they’ve developed in response to the unique economic environment, by raising production rates and decreasing drill times.”

 -1x-1


Saudi Arabia is strong, Iran is stubborn and the US is capable of a quick turnaround. This doesn’t provide much reassurance for production cuts. Crude prices remain vulnerable to a correction because of ample stockpiles. Inventories climbed 2.08 million barrels to 538.6 million in the week ended April 15. This was the highest amount since the 1930s.

Investors are trading on emotion. We’ve been ignoring fundamentals and just riding the waves of volatility. Tomorrow is going to be another day of emotional investing, people are going to be overreacting based on the economic data.

Many money managers are anticipating an increase in the WTI on Wednesday. Non-commercial contracts of crude oil futures, traded by large speculators (i.e. hedge funds) was +334,175 contracts in the data reported for April 19th. This was a change of +45,014 contracts from the previous week’s total of +289,161 reported through April 12th.

pic7376a423d1ce536936c69ec4afdde42e.png


There’s little doubt that the Federal Reserve is going to refrain from raising rates tomorrow but Yellen’s report will still provide insight into the current economic outlook. A positive report and no interest rate raises would give me reason to be long on oil… at least for Wednesday. Overall I don’t think there will be a significant change in inventory and the price will move much more on positive news then it would on negative news.

From what I know now oil has no reason to approach $50 per barrel. I would still be concerned about oversupply.


http://www.investing.com/analysis/wti-crude-oil-speculators-sharply-boosted-net-bullish-positions-last-wee-200126097

http://graphics.wsj.com/oil-barrel-breakdown/

http://www.bloomberg.com/news/articles/2016-04-24/oil-bulls-plunge-into-market-as-u-s-gasoline-demand-hits-record

http://www.platts.com/latest-news/oil/newyork/oil-complex-settles-higher-despite-oversupply-21342126


Economic Data: Business Activity and Inventories

“The welcome news of a sustained robust hiring in March… …masks a more worrying picture of a further slowing in economic growth so far this year.”

“Demand is growing at the slowest rate since late 2009 and, with business optimism also sliding to its weakening since the recession, firms clearly expect worst to come. Firms are worried about a potential weakness in demand both at home and abroad in the face of various headwinds” – Chris Williamson

Services Business Activity PMI Index – March 2016

April 5th

Business activity continued its upward trend in March to 51.3 up from 49.7 in February. Rising above 50 means that business activity is in expansion siting some positive economic data. That being said this current data set is still the second-lowest since October 2013. So while improving, the Business Activity is still No Bueno. The average business activity for the first quarter of 2016 was the weakest it has been since Q3 of 2012.

New business expansion and growth was the weakest it has been in the six-and-a-half years of Markit data collection. As with most bad data that we’ve been receiving the main explanation for this is an ‘uncertain economic outlook’.

Companies did boost their payroll numbers. They cited the increase in staffing levels to be due to the launch of new business products and long-term expansion.

https://www.markiteconomics.com/Survey//PressRelease.mvc/5cfd7e03fa634394b497dbf0cd5620c7

Inventory and Sales February – 2016

April 8th

Sales were down .2% from the revised January sales and 3.1% from the February 2015 level. The majority of this is due to petroleum sales which were down 10.1% from last month. Durable goods were up 1.2% from last month.

Inventories were down .5% (the Fed estimated -.2%) from the revised January level and were up .6% from the February 2015 level. A decrease in inventories is a negative into the calculations on GDP.

The inventory/sales ratio was down .1. If the sales were down, but inventory was down even more companies are failing to build up inventory. They are unwinding/creating a sell-off probably due to the ‘uncertain economic outlook’.

These low inventory results for Q1 were drastically different than the Fed’s original +.3%. Realizing this big shift is one of the main reasons the Atlanta Fed adjusted its GDP growth to .1.

http://www.census.gov/wholesale/pdf/mwts/currentwhl.pdf


This data supports the cautious tightening approach that the Fed and Janet Yellen have advocated for. Look for any clues that allude to a negative Q1 GDP. We could potentially be on the eve of recession if we aren’t in one already.

Economic Data: March 24th – 25th

I want to express my condolences to all of the families currently affected by the terrorist attacks in Belgium. Ok, now I want to point out that I’m an arrogant college student whose condolences mean shit. People offer their grievances in catastrophes such as this, thinking that it shows an awareness or an emotional attachment that transcends self-interest. In reality we just perpetuate that ignorance and selfishness we were trying to avoid in the first place. These petty attempts of compassion, whether changing your profile picture to a French flag or updating a status to “stand in solidarity” with the victims, only continue to belittle the actual tragedy. We internally find some satisfaction in these tragedies as we convince ourselves that we are patriots of freedom fighting to defend the all that is ‘good’ in this world. The media makes it even worse as they find ways to turn the attacks into a political landscape on what presidential candidate would handle these types of situations more effectively. So how do we avoid this paradox of altruism versus egocentricity? We can be more constructive by attempting to engage people directly who have been personally affected by these events, we can continue to promote intellectual discourse to try and better understand the conflict between fundamentalism and capitalism,  and finally we can look for ways to support the community around us fighting hate with actions of kindness and compassion.

Well that’s not what I originally planned to write about. I just became more side-tracked then “Squirrel!” that talking dog in the Disney movie UP. Anyway let’s look at some economic data. I’ve been slacking in my analysis of the US economy as my recovery from Spring Break in Cancun took longer than I anticipated.

GDP and Corporate Earnings– March 25th 2016

The third revision for the GDP in Q4 increased to 1.4 up from the advanced estimate of 1.0. The overall state of the economy performed better than anticipated which the Fed might use to as reinforcement for raising interest rates.

Corporate profits had a dismal Q4. The profits from current production decreased $159.6 billion, up from $33.0 billion in Q3. Profits of domestic financial corporations decreased $24.0 billion in Q4 which is much lower than the increase of $1.8 billion in Q3.

http://www.bea.gov/newsreleases/national/gdp/gdpnewsrelease.htm

Durable Goods Report – March 24th 2016

New Orders for manufactured durable goods decreased $6.6 billion by 2.8% in February following a 4.2% increase in January.

Shipments decreased $2.1 billion in in February down .9%.

Inventories of manufactured durable goods in February, down seven of the past eight months decrease $1.1 billion, down .3%.

There continues to be this weakness in durable good, especially in transportation. However, after reading the WSJ people l could barely find an article where any investors show concern.

http://www.census.gov/manufacturing/m3/adv/pdf/durgd.pdf


 Markit Flash Services PMI – March 24th 2016

US Services indicated a rebound in March after “A decline driven partly by east coast snow disruptions in February”. The consensus called this rebound “marginal” suggesting a slowdown in growth momentum. The index was 51.0 in March up from 49.7 in February. This average reading for the first 3 months of 2016 (51.3) was the lowest quarterly expansion pace since Q3 2012. This is also the softest expansion of growth since the survey began in October 2009, the beginning of the Recession! The reports detailed uncertainty in the future business environment with subdued business optimism.

One positive was that the rate of hiring stayed around 200,000 growth in March. According to Chief Markit Economist Chris Williamson “Such strong hiring at a time of weak output growth suggests productivity is trending down at the fastest rate seen over the past six years.

screen shot 2016-03-24 at 9.51.41 am

https://www.markiteconomics.com/Survey//PressRelease.mvc/673fe609a2ec4e6d8835ef927a94a1bf


 Kansas City Fed Manufacturing Survey – March 24th 2016

Factories reported another decline in March although the drop was smaller than in the previous three months. The index was -6 in March up from -12 in February and -9 in January. Manufacturing is still struggling to rebound. The capital expenditure index declined from -10 to -19, declining to its lowest level since December 2009 with a lot of this decline coming from the energy sector.
While capital spending is still constrained some believe that there are new potential business opportunities in the manufacturing industry.

https://www.kansascityfed.org/~/media/files/publicat/research/indicatorsdata/mfg/2016/2016mar24mfg.pdf?la=en


Existing Home Sales in February 2016 – March 24th 2016

Existing Home Sales were down 7.1% in February to 5.08 million. Despite the continued improvement in the labor statistics the sales are meaningfully lower now than one year ago. There was a decline in inventory from last year by 1.1% but was up for the year in 3.3% for the month. The unsold inventory was up 4.0%.

Home prices were up despite the weakness sales activity and have been rising faster than wages. The decreasing affordability and the increased economic uncertainty have been headwinds to consumer spending on houses.

http://www.realtor.org/news-releases/2016/03/existing-home-sales-fizzle-in-february


Like Smalls in the movie Sandlot I’m new to the game. I haven’t been around long enoughyoure-killin-me-smalls-quote-1
to understand the implications of terrible economic data such as the numbers that we have been recently receiving. I’m still figuring out the weight of importance that corporations, the Fed, and the US government put on reports such as the ones above. Maybe these numbers don’t mean that much. Maybe they aren’t nearly as important as the unemployment rate or the number of people entering the workforce. But as a rational investor I would have to consider these numbers to be significant indicators of the poor state of the US economy. I just wonder if the Fed feels the same… and if this will change their minds on raising rates in April.