The Chicago Boards Options (CBOE) describes the volatility index as “a key measure of market expectations of near-term volatility conveyed by S&P 500 stock index option prices”. The VIX was inducted in 1993 and since then has been considered a premiere benchmark to express investor sentiment and market fluctuation. After investors expressed interest in trading securities related to the measure of volatility, VX futures were introduced in 2004 and options in 2006. Since then various leveraged and non-leveraged ETFs tracking the VIX have also been integrated into the market once again holding the attention of investors.
VIX is calculated by “averaging the weighted prices of the S&P 500 index (SPX) puts and calls over a wide range of strike prices” or the square root of the 30-day variance of the S&P 500 rate of return multiple by 100. The 30-day variance looks at the sum of squared standard deviations around the S&P 500 within the 30-day period. These variance prices can be estimated by looking at the forward prices of SPX options because “the forward price of the strip represents the market’s risk-neutral expectation of that variance”. It is a general assumption based on the premiums investors pay on either the right to buy or sell stock.
The Relationship of the SPX and the VIX® Index
Below is a chart found on Bloomberg, originally cited from the CBOE site, showing the relationships between the S&P 500 and the VIX index since its induction in 1993. Most investors consider VIX to be an inverse of the S&P 500, representing both fear in the market and a bearish sentiment. During periods of market turmoil, as in the 2008 credit crisis the VIX sharply rises as the S&P 500 falls. One of the biggest questions people generally ask is: Why does the volatility index not increase when the S&P 500 increases on surging volume. In my opinion there are two main reasons: The options that comprise VIX are actually overweight puts than calls, which gives it a negative delta. Due to this negative delta, it is difficult for the VIX to go up when the S&P 500 goes up. Secondly, market corrections will generally result in a quick, sharp selloff of assets while the S&P 500 will generally rise in a slow, controlled manner; this has been the case recently as the S&P 500 has risen above 19,000 for the first time ever, gradually increasing since 2008 with few corrections in between. To summarize, investing in volatility generally means you’re taking a short position on the S&P 500.

I discuss this topic because right now volatility is historically cheap. August 2016 was the least volatile of any 30-day period in more than two decades. Only five days during the most recent stretch saw the S&P 500 move by more than 0.5% in either direction, the lowest since the fall of 1995. The trading inactivity has continued since January as the Federal Reserve continues to avoid raising rates (which will probably change in December) and investors waited to see what would happen in the election. Alas Trump won, and the stock market kept on truckin, just like Casey Jones, driving that train forward high on a euphoric cocaine. Wouldn’t it make since to buy some type of security representing volatility? I mean despite the recent market activity don’t people usually preach ‘buy low, sell high’? With the accessibility of ETFs tracking VIX, your average joe investors are able to think about purchasing these current sedated market conditions.
UVXY
I first heard about UVXY in my equity investments class at Wake Forest. The class was participating in a portfolio management challenge pitting different teams against each other to see who could earn the highest rate of return during the semester. One of my teammates suggested that we invest in UVXY on the basis that it would be a good hedge against any market downturn– it was January 2016 at this time so markets were uncertain as China’s currency crashed and the Fed raised rates. It seemed like a good idea at the time, but as the semester got further under way the losses on UVXY continued to increase. It’s safe to say we didn’t win the competition, but it did compel me to look into the mechanics of the strange ETF.
The ProShares Ultra VIX Short-Term Futures (UVXY) is a doubled levered ETF tracking the VIX. According to its prospectus the value of UVXY is closely tied to twice the daily return of the S&P VIX Short-Term Futures. Every day the index changes, tracking a different set of VIX futures contracts as older contracts expire and investors roll-over to new contracts. Like a stock, UVXY’s shares can be split or reverse split. UVXY is unique in that it reverse split five times in its first four years of existence – a feat that may be a record in the ETF realm. The last reverse split was 5:1.
Recently markets have hit a brief period of euphoria as Trump’s nomination leads to speculation that there will be less financial regulation, increased spending on US infrastructure, and an easing of fiscal policy. The Dow has climbed relentlessly, rising over 19,000 for the first time since its induction and we are in one of the longest bull markets in US history. Any rational investor with an attention span longer than a gold fish remembers the 2008 recession and knows that this rally may be too sweet to last. Some heralds keep crying that asset prices are overvalued and a bubble is brewing, inflated by the Feds easy monetary policy. As an investor, it seems tempting to jump into a product tracking VIX, especially because volatility indicators are so low.
When I originally saw UVXY, it seemed like a no brainer. When the markets tank, these long volatility positions are perennial powerhouses. Data for the 2011 correction shows that UVXY’s value went up 550% in a few months and UVXY’s percentage moves averaging -5.96 times the S&P 500’s percentage move. The record one-day VIX jump so far was a 59% jump in February 2007. If I buy UVXY now at such a low rate I could easily double my returns if I just waited for the next correction. Unfortunately, nothing’s ever free and there’s a lot more to this security than the eye can see (Phonetically that sentence was brilliant).
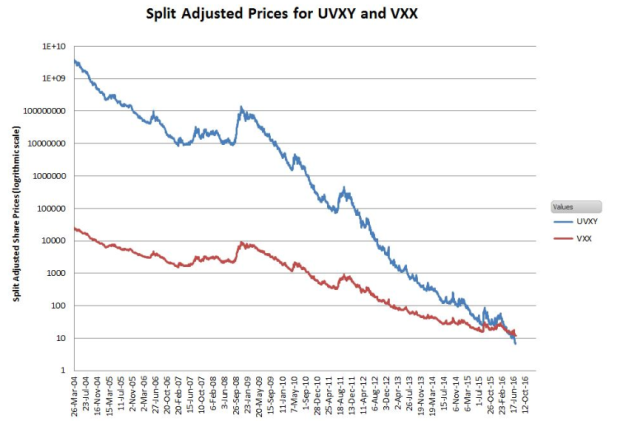
These geared funds surge when there is a spike in volatility but this appreciation is very short-lived and always leads to all-time trading price lows. The chart above shows the shocking truth about UVXY and how the fate is sealed for this ETF. These ETFs just went from perennial powerhouses to landslide losers due to one simple anomaly: Contango. Contango refers to when current futures prices are less than the expected future spot price. More simply stated, an investor pays higher prices for options that have more distant expiration dates. The counterpart of Contango is Backwardation. Backwardation occurs when the futures price of a commodity is lower than the spot price today. There is a higher demand to hold commodities contracts today compared to paying for the contracts at a later date. Backwardation aligns with bearish market sentiment – the price of the commodity is expected to be less in the future. Backwardation is beneficial when investors take net long positions as the futures prices are expected to converge (rise) toward the spot price. Contango markets are unloved by holders of long-only index products because of the negative yield encountered when expiring contracts are replaced by forward-month deliveries. Index funds, of course, must maintain constant exposure to their component futures. Holding futures into an expiration month creates a delivery risk, so part of a index’s methodology specifies protocols for rolling futures positions forward. To roll a long position, the soon-to-expire contract that is converging on the current spot price is sold as the distant delivery is simultaneously purchased at a higher price. The UVXY is always going to be heading toward zero with the reverse splits being continuing to artificially prop of the price. Another way to look at it is if Proshares had not reverse split UVXY it would now be trading at $ 0.0000167 per share.

It’s easy to conclude that if you plan on going long on UVXY then you better hold the position for no more than a week or be able to time the next catastrophic event. Otherwise stay away. So the next question is why not short UVXY if it is almost definitely decreasing in price. Well, many investors do, and come away with decent returns. Shorting UVXY is difficult though because you will need margin capabilities and it can be a crowded, illiquid market. Finally, you do not want to be on the wrong side of an instantaneous jump in volatility. In the event of a calamity resulting in a market crash the upside for volatility would be endless while the downside for short-sellers would be devastating.
http://www.cboe.com/micro/vix/vixintro.aspx
http://www.wsj.com/articles/its-getting-scarily-quiet-in-the-stock-market-1471889703

 automobiles.