Where Does Oil Go From Here?

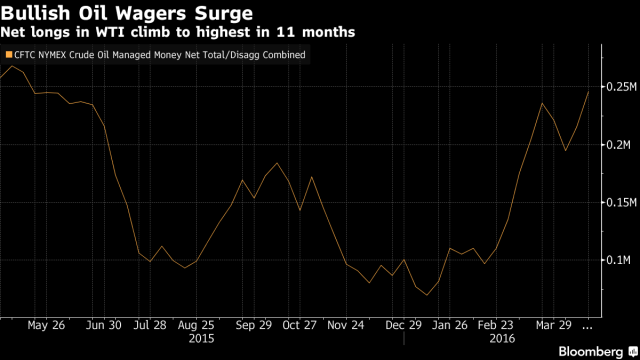
“The plunge and then surge of commodity prices this year shows investors have spent more time watching each other than watching the fundamentals”


Tomorrow is a big day in the global markets with three significant economic releases: the Fed policy meeting, the Bank of Japan policy meeting and a crude oil inventory report. These three reports each will provide some sort of insight into the economy’s direction in the next three months.

Oil will be heavily influenced on the outcome of both the Fed report and the inventories report. The economic instability, strong dollar, and supply gut earlier this year left oil crashing below $27 per barrel. Oil’s decline had wiped out over 10,000 jobs and resulted in more and more energy company bankruptcies. Uncertainty, the sworn enemy of Wall Street, has seemed to be beaten back. Global markets have stabilized in March and April but they are still entering unknown territory with such a drastic difference in monetary policies in countries such as Japan, Europe the United States and China. With oil recovering from its lows of below $27 a barrel to approximately $44.40 on Tuesday the next question is where will it go from here?

On April 17th there was a much anticipated meeting between some of the world’s largest oil producers to see if they could come to an agreement to freeze production output and thus raise prices. The talks were destined to fail. Iran choose not to attend the meeting, intent on raising production to meet pre US sanction supply. Saudi Arabia put the nail in the coffin when they demanded that they would only cap their production levels if Iran did the same.

US Gasoline Demand

Crude indexes were volatile the week before the meeting but surprisingly many investors shrugged off the failure to come to an agreement. Much of this was due to the surge in gasoline demand in the US. US gasoline consumption, averaged over four weeks, rose 3.9 percent from a year earlier to 9.39 million barrels a day through April 15, Energy Information Administration data show. Demand this summer will increase 1.4 percent to a record, the EIA said April 12. Along with this robust demand there are still expectations that production will decline as they did when distillate inventories decreased by 1.1 million barrels in late March.

“Gasoline demand is quite strong and that’s all price driven,” said Thomas Finlon, director of Energy Analytics Group LLC in Wellington, Florida. “Demand for gasoline should provide support for crude.”

Saudi Arabia vs Iran

Russia has been at the forefront of expressing a willingness to negotiate. However, the world’s largest oil producer isn’t stupid. Russia doesn’t anticipate any new initiatives to freeze oil production before an OPEC meeting scheduled for June, according to Energy Minister Alexander Novak. The majority of the inability to negotiate stems from the competitive relationship between Russia’s ally Iran and Saudi Arabia.

Despite Deputy Crown Prince Mohammed bin Salman’s attempt to diversify Saudi Arabia’s economy over the next couple of years, for the time being they will continue to have to be dependent on their black gold. They can continuing taking advantage of their location sites near the surface of the desert and the large size of their fields. Saudi Arabia is in the best position to operate on the global scale as they have the lowest costs of production per barrel alleviating some of the damage from these low prices. They have also established long term contracts with countries such as Japan allowing for a lot more security in demand.

With the lifting of sanctions Iran is looking to ramp its exports back up to two million barrels a day and regain its market share in Europe. They are currently increasing production by 300 to 350 thousand barrels a day and are shooting for 500 thousand in the upcoming months. They are trying to diversify into Asian markets which will be difficult because of the price pressure that Saudi Arabia creates with their long term contracts.

I don’t see any reason for two of the largest producers of oil to curb production.

Capture
What about the US?

U.S. oil prices have climbed more than 60% from a 13-year low reached in February. This increase is despite many indicators that global supply is going to be cut. Even though prices have been boosted by the surge in gasoline demand which I mentioned earlier, much of the positive sentiment stems from an improving economic outlook.

US oil producers have been hit hard in the past year. US producers have entered 2016 with estimated capital expenditures cuts of 40%, more than 6,500 drilled but uncompleted wells in inventory, and find themselves operating at or near cash costs.

Analyst of Platts Oil Suzanne Minter does a great report on the ability of the US to respond to an increase in oil prices. She states that, “It is plausible to believe that U.S. spare capacity may be close to rivaling OPEC’s current spare capacity. However, we believe that the prices needed to incentivize the U.S. producer to complete their drilled but uncompleted wells may be much lower than global competitors believe or would like it to be.”

Suzanne basically says that prices are too low right now and that US companies are waiting for the prices to catch up in order to revamp production. She continues to say, “US producers may be in the best position to lead the recovery, given the technical prowess they’ve developed in response to the unique economic environment, by raising production rates and decreasing drill times.”

 -1x-1


Saudi Arabia is strong, Iran is stubborn and the US is capable of a quick turnaround. This doesn’t provide much reassurance for production cuts. Crude prices remain vulnerable to a correction because of ample stockpiles. Inventories climbed 2.08 million barrels to 538.6 million in the week ended April 15. This was the highest amount since the 1930s.

Investors are trading on emotion. We’ve been ignoring fundamentals and just riding the waves of volatility. Tomorrow is going to be another day of emotional investing, people are going to be overreacting based on the economic data.

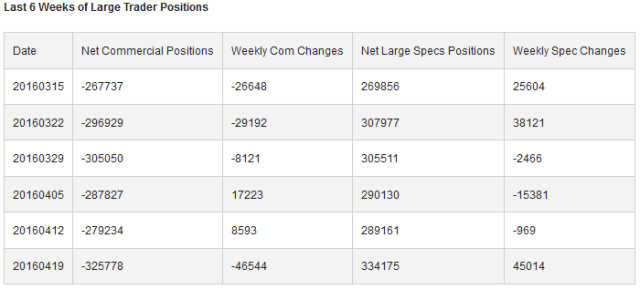
Many money managers are anticipating an increase in the WTI on Wednesday. Non-commercial contracts of crude oil futures, traded by large speculators (i.e. hedge funds) was +334,175 contracts in the data reported for April 19th. This was a change of +45,014 contracts from the previous week’s total of +289,161 reported through April 12th.

pic7376a423d1ce536936c69ec4afdde42e.png


There’s little doubt that the Federal Reserve is going to refrain from raising rates tomorrow but Yellen’s report will still provide insight into the current economic outlook. A positive report and no interest rate raises would give me reason to be long on oil… at least for Wednesday. Overall I don’t think there will be a significant change in inventory and the price will move much more on positive news then it would on negative news.

From what I know now oil has no reason to approach $50 per barrel. I would still be concerned about oversupply.


http://www.investing.com/analysis/wti-crude-oil-speculators-sharply-boosted-net-bullish-positions-last-wee-200126097

http://graphics.wsj.com/oil-barrel-breakdown/

http://www.bloomberg.com/news/articles/2016-04-24/oil-bulls-plunge-into-market-as-u-s-gasoline-demand-hits-record

http://www.platts.com/latest-news/oil/newyork/oil-complex-settles-higher-despite-oversupply-21342126


Economic Data: Business Activity and Inventories

“The welcome news of a sustained robust hiring in March… …masks a more worrying picture of a further slowing in economic growth so far this year.”

“Demand is growing at the slowest rate since late 2009 and, with business optimism also sliding to its weakening since the recession, firms clearly expect worst to come. Firms are worried about a potential weakness in demand both at home and abroad in the face of various headwinds” – Chris Williamson

Services Business Activity PMI Index – March 2016

April 5th

Business activity continued its upward trend in March to 51.3 up from 49.7 in February. Rising above 50 means that business activity is in expansion siting some positive economic data. That being said this current data set is still the second-lowest since October 2013. So while improving, the Business Activity is still No Bueno. The average business activity for the first quarter of 2016 was the weakest it has been since Q3 of 2012.

New business expansion and growth was the weakest it has been in the six-and-a-half years of Markit data collection. As with most bad data that we’ve been receiving the main explanation for this is an ‘uncertain economic outlook’.

Companies did boost their payroll numbers. They cited the increase in staffing levels to be due to the launch of new business products and long-term expansion.

https://www.markiteconomics.com/Survey//PressRelease.mvc/5cfd7e03fa634394b497dbf0cd5620c7

Inventory and Sales February – 2016

April 8th

Sales were down .2% from the revised January sales and 3.1% from the February 2015 level. The majority of this is due to petroleum sales which were down 10.1% from last month. Durable goods were up 1.2% from last month.

Inventories were down .5% (the Fed estimated -.2%) from the revised January level and were up .6% from the February 2015 level. A decrease in inventories is a negative into the calculations on GDP.

The inventory/sales ratio was down .1. If the sales were down, but inventory was down even more companies are failing to build up inventory. They are unwinding/creating a sell-off probably due to the ‘uncertain economic outlook’.

These low inventory results for Q1 were drastically different than the Fed’s original +.3%. Realizing this big shift is one of the main reasons the Atlanta Fed adjusted its GDP growth to .1.

http://www.census.gov/wholesale/pdf/mwts/currentwhl.pdf


This data supports the cautious tightening approach that the Fed and Janet Yellen have advocated for. Look for any clues that allude to a negative Q1 GDP. We could potentially be on the eve of recession if we aren’t in one already.

Be Like Mayo: Invest in a Roth IRA

Millennials are lazy, entitled and can’t get out of their parent’s basement. Millennials are wizards of social media, liberal, and ready to change the world. However, the majority of ‘change’ that occurs is when my generation, over social media, calls out a micro aggression or demonizes anyone who does something that isn’t politically correct. It’s
easy to get behind a cause when all you have to do is log on to Facebook and watch an out-of-Picture1
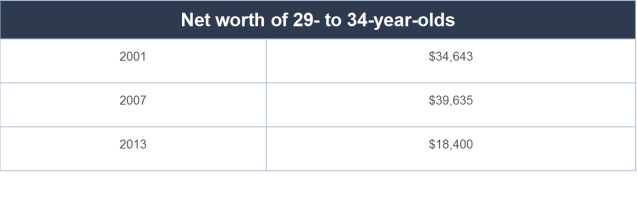
context video that makes you feel smarter. Students are showing just how coddled our generation is. Whether the Halloween incident at Yale or the response to the Trump-chalkers at Emory, these students are doing an excellent job at censoring anyone from saying anything provocative for the fear of being defamed. While I disagree with the majority of these negative stereotypes, some of these events have me worried about the future of America. What is most unsettling to me is not the student protests or the dependence on technology but it is the state of our financial affairs. Millennials have less money to spend, more student loans, and are frequently becoming stuck in low quality jobs. Millennials, born between 1980 and 2000, are shaping our economy as they reach their prime spending and working years. But how can they shape our economy positively when they are in such a miserable financial state? Instead of using social media as a platform to complain about being the 99% or to promote Bernie Sanders’s policy of ‘free tuition’ we can take much more tangible steps to be financially secure. The first and perhaps most important step is to set up a Roth IRA.

To understand why you should invest in a Roth IRA first let’s look at why millennials don’t have any money. According to a Goldman Sachs report on Millennial Infographics in 2013 millennials have less money to spend due to lower employment levels and smaller incomes. While unemployment has been declining to its lowest levels in 2008 what good is it if 44% of millennials are stuck in low-wage, dead-end jobs (Stahl)?

Picture2

Not only do we have less money to spend but we are drowning in student debt. In the Goldman Report student loans have risen by almost 100%. The tuition at my alma mater Wake Forest will be $48,746 in 2016-17 and I can tell you that I’m not excited to balance paying my student loans with the extra high cost of living in New York.

Picture3


These economic conditions are changing the way our society operates. With lingering effects from the Great Recession and uncertainty about the future of the economy millennials are putting off important events in their lives such as marriage and purchasing their first house.

Picture4.png

But worst of all millennials are failing to save money. Data from the Federal Reserve show that millennials took more of a hit on their retirement accounts and they’ve recovered much less than the portfolios of the entire population as a whole. This table shows that the net worth of today’s 29- to 34-year-olds, that of older millennials, is significantly lower than the 2007 net worth of that year’s 29- to 34-year-olds. Jillian Berman of Marketwatch writes in 2015 that 52% of the millennials between the ages of 25 – 34 have less than $1000 in savings. 52%! How can they expect to do anything in the future: have kids, go on vacation, or retire?

paisdfsadf

You don’t need to be just another loser with no money. It’s time to save more efficiently and more effectively. How do you rise above these dreadful statistics? Invest in a Roth IRA. A Roth IRA is an individual retirement account which is an ideal savings vehicle for young, lower-income workers who won’t miss the upfront tax deduction and who will benefit from decades of tax-free, compounded growth. You can contribute to a Roth IRA at any age as long as you have earned income from a job. The Roth IRA is flexible. You can withdraw your contributions at any time without taxes or penalty and most income groups are eligible, especially at a younger age.

Roth IRAs are insanely easy to set up. You can use multiple IRA service providers such as Fidelity, Merrill Edge and E*Trade which provide one-on-one interactions with very little fees if any at all. Want to go at it by yourself and choose your own portfolio? Investing Guru Benjamin Graham always thought that it was best if the defensive investor put 90% of their portfolios into market index funds and left another 10% in their portfolio to fool around with. The best part of a Roth IRA is that you can start right away.

Most people are hesitant to start saving early – They want to wait until they’ve paid off debt or until they have a higher paying job. Many people don’t start seriously saving until their 30s. To put off saving is ludicrous because if you start saving early you get to utilize a very important and powerful tool. That tool is compounded interest. Compounded interest
occurs when the interest that accrues to an amount of money in turn accrues interest Picture12.pngitself. Compounding provides an easy path to becoming a millionaire by the time you retire. I like to think of it as free money. Your investments into your savings account continue to build and build upon each other until you have a large chunk of change in your pocket… tax-free.

If you still aren’t convinced that compounding interest is a big deal let me show you an example using a Roth IRA calculator. Two different scenarios. In the first, you start your IRA at 29, putting in $2,000 initially and thereafter investing a meager $1,200 a year. That’s only $100 a month. With a 7% return annually by the time you’re 65 you will have $214,053. Not bad. Here’s the kicker.In the second scenario you do the same exact thing only this time you start saving eight years earlier at the age of 21. By the time you retire you will have $380,956. That’s a 78% increase! That’s the power of compounding and I cannot emphasize enough the importance of starting early.

picture124.pngpicture123

21 years: $52,800 total contribution.              29 years: $43,200 total


“Compound interest is the eighth wonder of the world. He who understands it, earns it … he who doesn’t … pays it.”  — Albert Einstein


Millennials are market movers, changing the economic and social landscape. With rising college debt, an increase in part-time jobs, and lingering effects from the Great Recession it is important that the younger generation prudently saves through the use of a Roth IRA. Don’t hesitate, don’t just shrug off what I’m telling you, go to your computers, talk to your parents or your financial adviser and go invest in your future. Right now people my age have a very valuable commodity that most people don’t have. That commodity is time. Take advantage of this time and start saving money. It’s time to remove ourselves from the financial constraints of being a millennial and from the ensuing stereotypes.

So remember be like Mayo.


http://www.bankrate.com/calculators/retirement/roth-ira-plan-calculator.aspxhttps://

http://www.businessinsider.com/amazing-power-of-compound-interest-2014-7

http://www.goldmansachs.com/our-thinking/pages/millennials/

http://www.marketwatch.com/story/more-than-half-of-millennials-have-less-than-1000-2015-12-14

http://www.rentjungle.com/average-rent-in-new-york-rent-trends/

http://www.rothira.com/how-to-start-a-roth-ira#start

http://www.rothira.com/how-to-start-a-roth-ira#start

Sindex: Sailing with Castro

On Wednesday March 30th Carnival (CCL) was up approximately 5.72%, Royal Caribbean (RCL) 6.13% and Norwegian Cruise Lines 5.91%. The rise in cruise industry stock prices came after Carnival’s Q1 reported a near doubling of adjusted Q1 earnings.

These three companies make up more than 80% of the Cruise Line industry and competition only seems to be getting fiercer. In these volatile economic times the fate of these Cruise ships is uncertain. Foreign currency fluctuations, changing fuel prices, and consumer spending all have a large impact on the cruise line industry as does international relations.

Carnival Corporation & plc is the largest cruise company in the world, with a portfolio of 10 cruise brands globally.

They reported adjusted net income of $301 million, or $0.39 diluted earnings per share, for the first quarter of 2016 compared to adjusted net income for the first quarter of 2015 of $159 million, or $0.20 diluted earnings per share.

There net cruise costs excluding fuel per ALBD increased 1.6 percent in constant currency and were lower than December guidance, up 2.5 to 3.5 percent, due to the timing of expenses between quarters. Gross cruise costs including fuel per ALBD in current dollars decreased 6.0 percent due to changes in fuel prices and currency exchange rates. In the latest quarter, the company reported that its fuel expenses fell 41%, to $187 million from $318 million a year ago. The company uses both oil price hedging contracts as well as other energy-saving measures that, mixed with lower oil prices, seem to be a major way Carnival adds to its bottom line.

What is ALBD? ALBD or Available Lower Berth Day is a standard measure of capacity for cruise ships. It’s a great way to calculate net revenue yields based on the number of passenger rooms available relative to the number of operating days of the cruise ships.

Net revenue yields or net cruise revenues per ALBD declined by (2.1%) from 2014 to 2015 mostly due to foreign currency fluctuations. With a constant dollar revenue yields increased by 3.2%.

Carnival’s cash story is an interesting one. Cash rose from $280 million to $778 million in a year while maintaining dividend payouts and increasing stock buybacks by $916 million. $916 million! Carnival has revamped the share buyback program. They have bought back approximately 27 million shares returning $1.3 billion to shareholders in the last six months. They were mainly able to do this as Capital Expenditures decreased significantly, from $942 million to $330 million, in February 2015 to 2016. They weren’t interested in making too many additions to property and equipment.

The cruise-ship company, which operates Carnival Cruise Lines as well as the Princess, Cunard and Holland America lines, has benefited in recent quarters from broad-based booking strength and lower fuel costs. They are shifting assets to Holland America lines, Carnival’s luxury line, where they see potential for profitability and growth .

Just last week big news came in with Carnival. Carnival has the remarkable opportunity of sending cruise ships to Cuba. In early May they will begin seven day trips on the 700-passenger Adonia visiting Havana, Cienfuegos and Santiago de Cuba.


In early February Royal Caribbean released its 2015 earnings. The company’s adjusted earnings for 2015 were $4.83 per share – up 42% over 2014, and are expected to further increase to $5.90 – $6.10 in 2016. On a constant currency basis Royal Caribbean edged out Carnival with a net revenue yield of 3.5%. Adjusted Net Income for the full year 2015 was $1.07 billion, or $4.83 per share, compared to Adjusted Net Income of $755.7 million, or $3.39 per share, for the full year 2014.  This represents a 42% year-over-year increase.

Many believe that Royal Caribbean has more potential for growth and thus is a better investment. Cruise companies are competing for market share in the emerging Asia market. Including Carnival, companies are looking to increase the number of ships travelling to the Chinese market, but Royal Caribbean seems to be resonating the most with Chinese consumers. RCL was named “Best Cruise Operator” by Travel Weekly China for the seventh year in a row, the company announced last month.

However Royal Caribbean is also struggling in some parts of the globe. Due to the weakness in the economies in Latin America, it is re-focusing the Pullmantur brand on its core market of Spain and right-sizing the brand. This resulted in a $399.3 impairment charge. Part of this right-sizing includes anticipated restructuring and related charges during 2016 in the range of $0.05 to $0.10 per share.

I’ll be ignoring Norwegian Cruise Lines for the time being because their earnings are still too unpredictable and they do not yet have the maturity and stability to pay dividends.

Ratios

  • In mid-2015 Royal Caribbean was trading at a cheaper P/E than Carnival. Now their roles have reversed. Both are overvalued but Carnival’s average P/E ratio in the past 5 years is 21.7 while Royal Caribbean’s is a whopping 63.8.
  • Similar dividend payouts but Carnival seems more devoted to continuing to provide that shareholder value through dividends and stock buybacks.
  • Carnival’s 9.92% Interest Coverage Ratio shows they are more solvent than Royal Caribbean.
  • Carnival’s operating margins are more efficient and have been for the past 5 years.

Carnival currently outperforms Royal Caribbean in many areas of financial health, profitability and growth. For the fear of being a speculator I will denounce Royal Caribbean and choose Carnival for my world-renowned Sindex.

Cruise Ratios


http://phx.corporate-ir.net/phoenix.zhtml?c=140690&p=irol-reportsannual

http://www.wsj.com/articles/BT-CO-20160330-708465

http://www.rclcorporate.com/investors/press-releases/press-release/id/1252/