Tobacco Industry
It’s no secret that the entirety of the tobacco industry is in decline. With significant risks including cigarette-related taxes, the imposition of discriminatory excise tax structures, increasing marketing and regulatory restrictions, and health concerns relating to the use of tobacco products it is counter-intuitive that people are willing to invest in these companies. That being said if company has a heartbeat then it is possible find merit.
The market for tobacco products has become extremely saturated. With declining sales due to the increased awareness of the negative health effects, companies such as Philip Morris International, Altria and Reynolds American are pursuing different growth strategies. The main avenues for value creation in this industry include research and development to find healthier alternatives to tobacco products, M&A, and providing ample dividends and share buybacks to entice shareholders.
Philip Morris (PM)
Until 2008, Philip Morris International (PM) was a wholly owned subsidiary of Altria Group, Inc. (MO). Since that time the company has been independent and is listed on the New York Stock Exchange. The rationale was that separating the international division would free up the company of any of the regulatory restraints in the United States. While Philip Morris and Altria offer some similar products under Marlboro they now operate using different supply chains in different geographic markets.
Philip Morris International had mixed results in the first quarter of 2016 throughout the different geographical divisions. Total PMI market share, excluding China and the U.S., increased by 0.2 percentage points to 28.7%, with organic cigarette volume down by 1.4%, due mainly to the Asia Region: Indonesia, Pakistan and the Philippines. This decline was partly offset by organic volume growth in the European Union and Latin American Regions.
One of the main positives was the strong cigarette volume performance from their international brands. The top seven brands grew volume with Marlboro and Parliament increasing by 1.1% and 5.9%, respectively. PMI is losing market share in countries such as Indonesia and Japan. They are attempting to counter the loss in market share by releasing innovative, risk-reduced products such as Parliament Crystal Blast e-cigs.
There has been exciting progress with iQOS commercialization and the continued Heatstick expansion in Japan. These products fall under the spectrum of Risk-Reduced Products that are at the core of new product development.
Philip Morris is raising EPS forecasts to an expected 10 – 12% for 2016 mostly due to the favorable currency conditions.
Perhaps the biggest reason investors buy tobacco stocks is due to the dividend yield. Since PMI spun off from Altria they have had eight consecutive dividend increases with a current payout ratio of 95.5%. The payout ratio, or the ratio of earnings to dividends paid to investors, is significantly higher than Altria’s ratio of 79.9%. However, PMI’s dividend per share of $3.51 barely exceeds Altria’s $3.40.
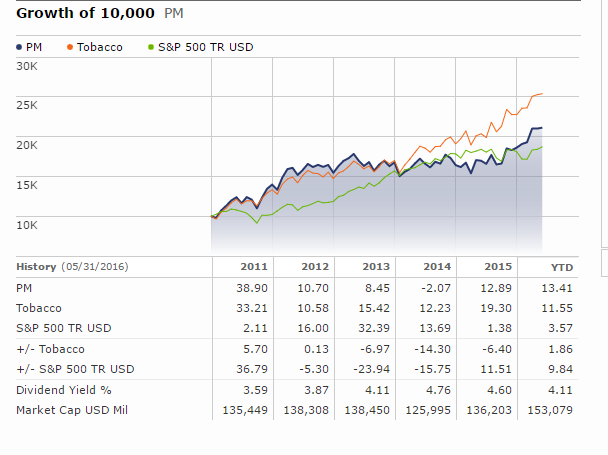
As you can see in the chart below since 2013 PMI has been significantly underperforming compared to the rest of the tobacco industry. Year over year the Q1 EPS decreased by 15.5% from a diluted EPS of $1.16 in 2015 to $.98 in 2016. PMI attributes this to a strong Q1 in 2015 and to an unfavorable currency. They make it sound like the unfavorable currency is a one-time charge as the make sure to include that the Adjusted EPS excluding currency is $1.17. This is the exact risk you’re buying into if you invest in an international company compared to alternatives such as Altria and Reynolds American. With quantitative easing in the EU and negative interests rates in Japan you better be prepared for volatile currencies if you want to invest in PMI.
Altria
From 2011 to 2015, Altria delivered total shareholder return of 205%, which far outperformed the S&P 500.
Altria’s 2016 first-quarter reported that diluted earnings per share (EPS) increased 19.2% to $0.62. Altria reaffirms its 2016 full-year adjusted EPS $3.00 to be approximately $3.05, representing a growth rate of 7% to 9% from an adjusted diluted EPS base of $2.80 in 2015.
During the first quarter, Altria repurchased 2.8 million shares at an average price of $59.81 for a total of $168 million.
Similar to Philip Morris, Altria’s most successful brand lies with the Marlboro cigarettes. Marlboro’s retail share remained at 44.0% in the first quarter. They also have been able to diversify into other areas both in and outside of the tobacco industry.
- Altria’s subsidiary Middleton reported that their cigar shipment volume increased 8.3% in the first quarter, driven primarily by Black & Mild in the tipped cigars segment.
- Altria’s main chewing tobacco brands Copenhagen and Skoal’s combined reported shipment volume increased 8.7%, partially driven by the national expansion of Copenhagen Mint. While they are attempting to diversify into non-tobacco related industries such as the wine industry these profits are still proving inconsequential.
- In the wine segment, Ste. Michelle grew net revenues in the first quarter of 2016 by 8.2% However, operating margins are approximately 20% which brings down the Altria average.
Smokeable products continue to be Altria’s biggest business at $16.4 billion in annual revenue, and this still makes up 87% of the company’s business. Second in size is smoke-less products, such as chewing tobacco. At $1.7 billion in trailing revenues, that makes up a further 9% of Altria’s business. As for the remaining 4%, that derives from Altria’s wine business — which contributed approximately $668 million over the past year.
Altria, due to its long tenure, has been even more consistent than Philip Morris in terms of dividends. They have increased their dividend 49 times in 46 years. During the third quarter of 2015, the Board of Directors approved an 8.7% increase in the quarterly dividend rate to $0.565 per common share versus the previous rate of $0.52 per common share. Altria Group, Inc. expects to continue to maintain a dividend payout ratio target of approximately 80% of its adjusted diluted EPS. Philip Morris’s dividend payout only increased by 2% in 2015. However, over the past five Altria has grown its dividend by 8% per year. By comparison, Philip Morris has been more aggressive. It’s increased its dividend by 11% per year.
Finally, Altria is a cash cow with their free cash flow increasing by approximately 24% from 2014 to 2015 and 37% since 2011. Meanwhile since 2011 Philip Morris’s cash flow has decreased by 3.9%.

So What Do I Like More?
Over the past five years Altria’s P/E ratio has averaged 18.48 compared to Philip Morris’s 16.94. While both companies aren’t inexpensive I believe that Price to Cash Flow is just as important in an industry with declining revenue. Altria’s P/CF of 21.2 appears more favorable. Despite Altria’s debt of $12 billion they still have a better interest coverage ratio than Philip Morris and they have avoided the currency headwinds applicable to their international counterpart. In the short-term if you think that the dollar’s strength will decline than Philip Morris will become a lot more appealing as their international sales currently generate weaker returns. But as I said earlier, currency volatility isn’t an extraneous cost and in the long run it has the potential to plague PMI returns.
For the Sindex I think that Altria is the better buy. I would pay the premium for a company attempting to diversify beyond risk-reduced products who is not fully dependent on dividend growth.
I am a firm believer in the concept of “go with what you know”. I think that you can identify a company that is about to ditch its cocoon and turn into a beautiful butterfly (not literally) without being fully dependent on fundamentals. Sometimes it is hard for analysts to take their eyes off the charts, stock tickers, and earnings reports and notice the trends right in front of them. Besides Marlboro I truly think that Altria has strong brands in high demand. I’ve noticed that in my generation alone Black and Mild’s and chewing tobacco are often used as substitutes to cigarettes because they are deemed “less unhealthy”. While almost certainly untrue, just like in the stock market, perception triumphs over reason.

http://investor.altria.com/phoenix.zhtml?src=leftnav&c=80855&p=irol-reportsannual
http://financials.morningstar.com/cash-flow/cf.html?t=PM®ion=usa&culture=en-US